PC312 User Manual: Difference between revisions
No edit summary |
No edit summary |
||
| Line 672: | Line 672: | ||
The user needs to select on the “choose file”, upload the required file and click on apply. | The user needs to select on the “choose file”, upload the required file and click on apply. | ||
= 4.Status = | == 4.Status == | ||
In this module the user can view the status of the router device with respect to the network, Wan, modem etc. | In this module the user can view the status of the router device with respect to the network, Wan, modem etc. | ||
| Line 680: | Line 680: | ||
* Routes | * Routes | ||
* Custom Config | * Custom Config | ||
[[File:Protocol Converter Status Dashboard.png|frameless|620x620px]] | |||
=== 4.1 Interfaces === | |||
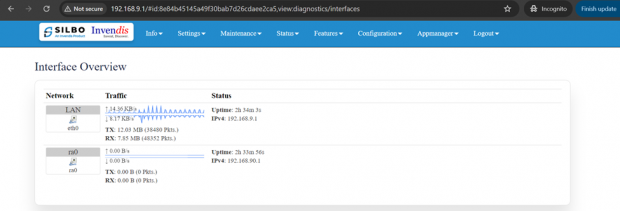
Each network device (interface) is associated with specific traffic statistics, uptime, and status. Active interfaces are operational. | |||
[[File:Protocol Converter Interfaces.png|frameless|620x620px]] | |||
Looking on the network status the user can check if the ewan is up. | |||
=== 4.2 Routes === | |||
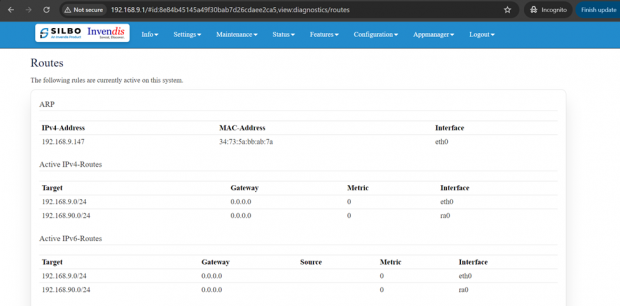
This configuration shows how the router directs traffic between different networks and interfaces, ensuring proper communication within the local network and to external networks via the default gateway. | |||
'''ARP Table:''' Maps IP addresses to MAC addresses for devices on the network, helping in identifying which device is on which interface. | |||
'''IPv4 Routes:''' This shows which network is directly connected on which interface. | |||
Example: Network '''192.168.9.0/24''' is directly connected on interface '''eth0.1.''' | |||
'''IPv6 Routes:''' Similar routes as IPv4, but this time listed under IPv6 routing rules. | |||
Example: Local networks '''192.168.9.0/24''' and '''192.168.90.0/24''' are managed through '''eth0.1''' and '''ra0''', respectively. | |||
[[File:Protocol Converter Routes.png|frameless|620x620px]] | |||
=== 4.3 Custom Config === | |||
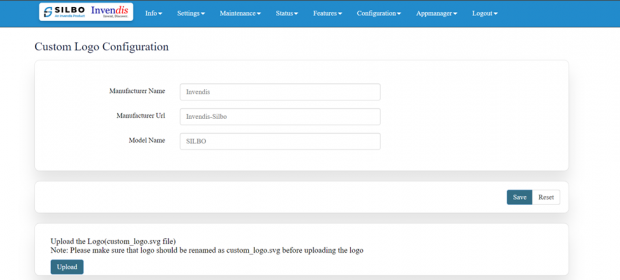
In this section, webpage logo can be customised as per requirements. | |||
Upload the custom logo by clicking the “Upload” tab below. | |||
[[File:Protocol Converter Routes Custom Config.png|frameless|620x620px]] | |||
== 5. Features == | |||
In this module the user can see all the features that the router device has. | |||
This module includes 3 features. | |||
* Web Server | |||
* Others | |||
* Connection Diagnostics | |||
[[File:Protocol Converter Features Dashboard.png|frameless|620x620px]] | |||
=== 5.1 Web Server === | |||
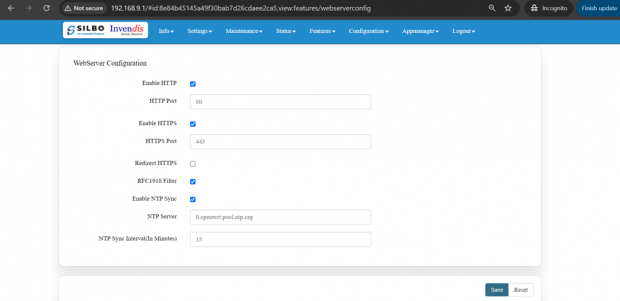
This configuration will allow your device to serve web traffic securely over HTTPS, keep its system time synchronized, and ensure that all HTTP traffic is redirected to HTTPS for better security. | |||
[[File:Protocol Converter Web Sever .png|frameless|620x620px]] | |||
Specification details are given below: | |||
{| class="wikitable" | |||
|SN | |||
|Field Name | |||
|Sample Value | |||
|Description | |||
|- | |||
|1 | |||
|Enable HTTP | |||
|'''HTTP Port:''' 80 | |||
Enable or disable the HTTP server. | |||
|Port 80 is the default port for HTTP traffic. It is used to serve web pages over an unencrypted connection. | |||
|- | |||
|2 | |||
|Enable HTTPS | |||
|'''HTTPS Port:''' 443 | |||
Enable or disable the HTTPS server. | |||
|Port 443 is the default port for HTTPS traffic. It is used to serve web pages over an encrypted connection. | |||
|- | |||
|3 | |||
|Redirect HTTPS | |||
|Option to redirect HTTP traffic to HTTPS. | |||
|When enabled, all HTTP requests will be automatically redirected to the HTTPS port to ensure secure communication. | |||
|- | |||
|4 | |||
|Enable NTP Sync | |||
|Enable or disable NTP synchronization. | |||
|Synchronizes the device’s system clock with an external NTP server to maintain accurate time. | |||
|- | |||
|5 | |||
|NTP Server | |||
|0.openwrt.pool.ntp.org | |||
|The address of the NTP server used for time synchronization. The openwrt.pool.ntp.org server is a public NTP server pool. | |||
|- | |||
|6 | |||
|NTP Sync Interval (In Minutes) | |||
|15 | |||
|The interval at which the device will sync its clock with the NTP server, set to every 15 minutes in this case. | |||
|} | |||
Click on save once changes are made. | |||
=== 5.2 Others === | |||
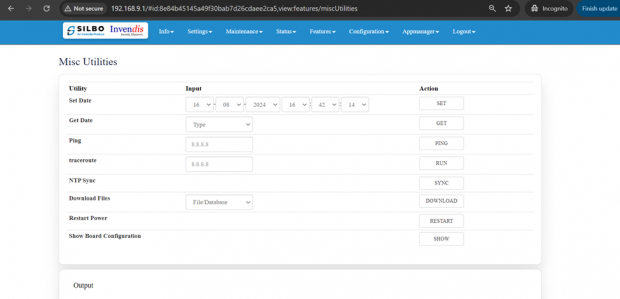
In this page the user will get to do all the other miscellaneous configuration with respect to the device based on the required parameters. Each utility serves a specific purpose, providing various functionalities for managing and troubleshooting network configurations and statuses. | |||
[[File:Protocol Converter Misc.png|frameless|620x620px]] | |||
Specification details are given below: | |||
{| class="wikitable" | |||
|SN | |||
|Field Name | |||
|Sample Value | |||
|Description | |||
|- | |||
|1 | |||
|Set Date | |||
|Date and time fields (day, month, year, hour, minute, second) | |||
|Sets the system date and time to the specified values. | |||
|- | |||
|2 | |||
|Get Date | |||
|System | |||
|Retrieves and displays the current system date and time. | |||
|- | |||
|3 | |||
|Ping | |||
|IP address or domain (e.g., 8.8.8.8) | |||
|Sends ICMP echo requests to the specified address to check connectivity. | |||
|- | |||
|4 | |||
|traceroute | |||
|IP address or domain (e.g., 8.8.8.8) | |||
|Traces the route packets take to reach the specified address. | |||
|- | |||
|5 | |||
|NTP Sync | |||
|Command ‘Sync’ | |||
|Synchronizes the system time with the configured NTP server. | |||
|- | |||
|6 | |||
|Download Files | |||
|File or database identifier | |||
|Initiates a download of the specified file or database. | |||
|- | |||
|7 | |||
|Restart Power | |||
|Command ‘Restart’ | |||
|Restarts the power of the device. | |||
|- | |||
|8 | |||
|Show Board Configuration | |||
|Command ‘Show’ | |||
|Displays the current board configuration. | |||
|- | |||
|9 | |||
|Output | |||
|Any value | |||
|Displays output for all the above actions. | |||
|} | |||
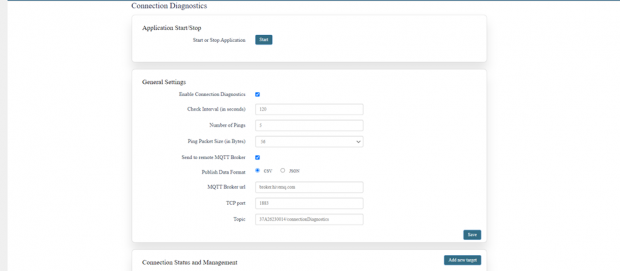
=== 5.3 Connection Diagnostics === | |||
This can ensure that your connection diagnostics application effectively monitors and reports the status of your network connections, providing valuable data for troubleshooting and performance optimization. | |||
[[File:Protocol Converter Connection Diagnostics.png|frameless|620x620px]] | |||
This Application works in 3 parts, | |||
1.) General settings | |||
2.) Connection status and management | |||
3.) Application Start/Stop | |||
[[File:Connection Diagnostics dashboard.png|frameless|620x620px]] | |||
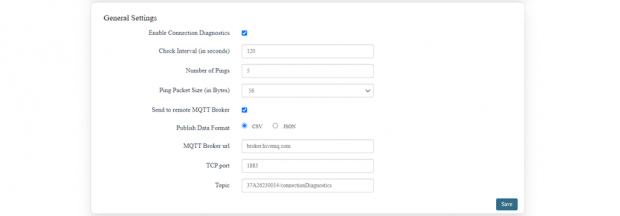
'''General settings:''' | |||
First make configuration changes in this section and save. | |||
[[File:Connection Diagnostics General Settings.png|frameless|620x620px]] | |||
Specification details are given below: | |||
{| class="wikitable" | |||
|SN | |||
|Field Name | |||
|Sample Value | |||
|Description | |||
|- | |||
|1 | |||
|Enable Connection Diagnostics | |||
|Enable/Disable | |||
|This option enables or disables the connection diagnostics functionality. | |||
|- | |||
|2 | |||
|Check Interval (in seconds) | |||
|'''Value:''' 120 | |||
|Specifies how often (in seconds) the diagnostics checks are performed. In this case, every 120 seconds. (min 60 secs) | |||
|- | |||
|3 | |||
|Number of Pings | |||
|'''Value:''' 5 | |||
|Determines ping requests sent during each check. | |||
|- | |||
|4 | |||
|Ping Packet Size (in Bytes) | |||
|'''Value:''' 56 | |||
|Defines the size of each ping packet in bytes. | |||
|- | |||
|5 | |||
|Send to remote MQTT Broker | |||
|Enable/Disable | |||
|This option enables the sending of diagnostic data to a remote MQTT broker. | |||
|- | |||
|6 | |||
|Publish Data Format | |||
|'''CSV''' / '''JSON''' | |||
|Specifies the format in which the diagnostic data will be published to the MQTT broker. You can choose either CSV (Comma-Separated Values) or JSON (JavaScript Object Notation). | |||
|- | |||
|7 | |||
|MQTT Broker url | |||
|'''Value:''' broker.hivemq.com | |||
|The URL of the MQTT broker where the diagnostic data will be sent. | |||
|- | |||
|8 | |||
|TCP port | |||
|'''Value:''' 1883 | |||
|The TCP port used to connect to the MQTT broker. Port 1883 is the default port for MQTT. | |||
|- | |||
|9 | |||
|Topic | |||
|'''Value:''' 37A26230014/connectionDiagnostics | |||
|The MQTT topic under which the diagnostic data will be published. This topic is used to categorize and identify the data. | |||
|} | |||
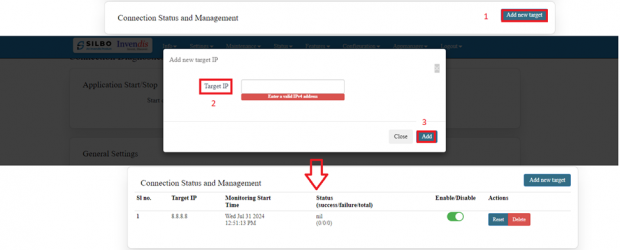
'''Connection status and management:''' | |||
To setup a connection, | |||
Click on ‘Add new target’ | |||
Enter Target IP (Ex: 8.8.8.8) | |||
Click ‘Add’ | |||
Target has been added successfully. | |||
[[File:Connection status and management.png|frameless|620x620px]] | |||
'''Application Start/Stop:''' | |||
To check whether the target Ip is sending and receiving packets, you need to start the application to see the desired output. | |||
[[File:Application Start-Stop.png|frameless|620x620px]] | |||
As shown above, our target Ip is sending packets successfully. | |||
You can Add as many targets IP’s you need to monitor. | |||
You can leave the application on for monitoring else ‘Stop’ the application. | |||
Revision as of 07:26, 20 August 2024
Connecting with Protocol Converter to the System (Laptop/Desktop)
To log in to SILBO_PC312 by connecting the Protocol converter to your laptop or desktop via LAN or using Wi-Fi, please follow the steps below.
Connecting via LAN:
Connect your laptop's LAN port to the Protocol Converter’s LAN interface.
How to connect with the SILBO_PC312 application
Once the LAN connection is established between the device and the laptop or the desktop
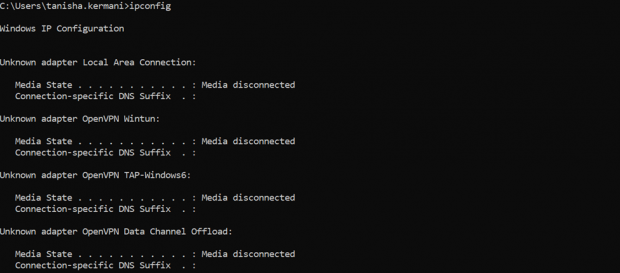
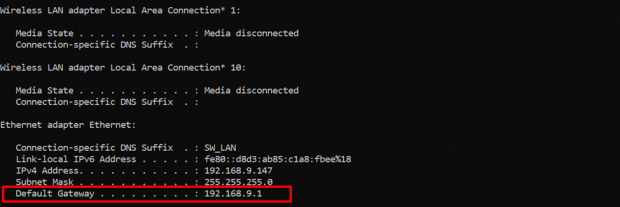
Please open the command prompt and ping to get the IP config of that device.
Type the command Ipconfig
It will provide the Ip address/url of that device through which the application can be accessed.
Log In
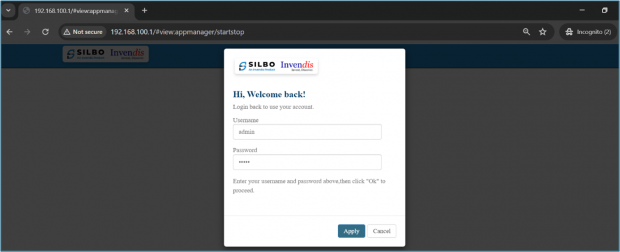
Open the web browser and type the IP address in the URL.
It will show the log in page of the application.
Give the valid credentials for the username and password to login to the application page.
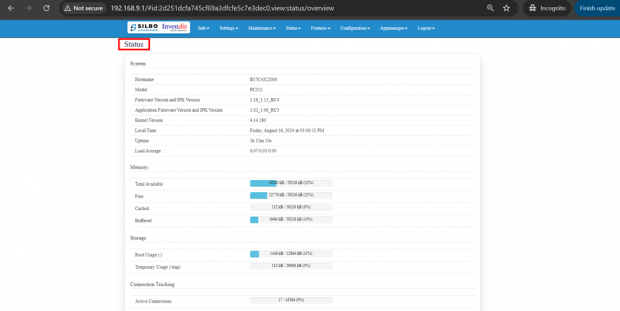
Once the user credentials are provided it will direct to the landing page of the application.
The “Status” landing page shows all the detailed specification of the device like system, memory storage and connection tracking etc.
The application is divided in to 8 Modules.
- Info
- Settings
- Maintenance
- Status
- Features
- Configuration
- Appmanager
- Logout
1. Info
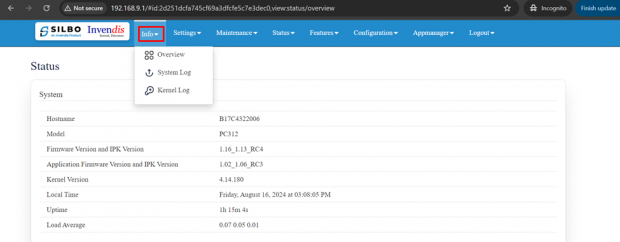
The “Info” module provides the information about the devices to the user.
It provides all the specification related to the hardware, firmware, Networks and the Connection uptimes.
It has 3 submodules.
- Overview
- System Log
- Kernel Log
1.1 Overview
In overview module it displays all the specification categorically of a device like System, Memory, storage, Connection tracking, DHCP Lease.
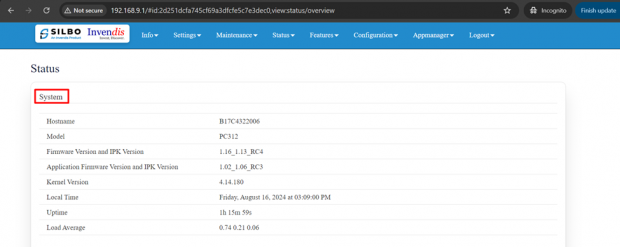
System:
In this section it displays the hardware configured specification of the device.
The specifications details are as follows,
| SN | Field name | Sample value | Description |
| 1 | Hostname | B17C4322006 | This field displays the router serial number of the device |
| 2 | Model |
|
This field displays the model number of the device |
| 3 | Firmware Version and IPK Version | 1.16_1.13_RC4 | This field displays the firmware version and IPK version |
| 4 | Application Firmware version and IPK version |
|
This field displays the software version of the device. |
| 5 | Kernel Version | 4.14.180 | This field displays the kernel version of the device |
| 6 | Local Time | Tuesday, August 6, 2024 at 01:15:07 PM | This field displays the local time |
| 7 | Uptime | 1d 2h 23m 25s | This field displays the uptime of the device |
| 8 | Load Average | 0.45 0.30 0.19 | This field displays the average load |
Memory: In this section it displays the memory configured specification of the device.
The specifications details are as follows.
| SN | Field name | Sample value | Description |
| 1 | Total Available | 57716 kB / 124188 kB (46%) | This field displays the total availability of memory space in the device |
| 2 | Free | 46424 kB / 124188 kB (37%) | This field displays the Free memory space in the device |
| 3 | Cached | 444 kB / 124188 kB (0%) | This field displays the Cached memory space in the device |
| 4 | Buffered | 11224 kB / 124188 kB (9%) | This field displays the Buffered memory space in the device |
Storage: In this section it displays the status of storage as root and temporary usage specification of the device.
The specifications details are as follows.
| SN | Field name | Sample value | Description |
| 1 | Root Usage | 1580 kB / 12800 kB (12%) | This field displays the total root usage of the device |
| 2 | Temporary Usage | 444 kB / 62092 kB (0%) | This field displays the total temporary usage of the device |
Connection Tracking:
In this section it displays the status of connection tracking for the device.
The specifications details are as follows.
| SN | Field Value | Sample Value | Description |
| 1 | Active Connections | 48/16384 (0%) | This field displays the active connection of the device. |
DHCP Leases:
In this section it displays the DHCP lease of the temporary assignment of an IP address to a device on the network.
The specifications details are below.
| SN | Field name | Sample value | Description |
| 1 | Host Name | KermaniK-LT | This field displays the configured Host Name/Username for that device. |
| 2 | IPv4-Address | 192.168.10.147 | This field displays the IP address of the device. |
| 3 | MAC-Address | 34:73:5a:bb: ab:7a | This field displays the MAC-Address of the device. |
| 4 | Lease time remaining | 11h 53m 49s | This field displays the lease time remaining for the device. |
1.2 System Log
This page provides on screen System logging information. In this page the user gets to view the system logs.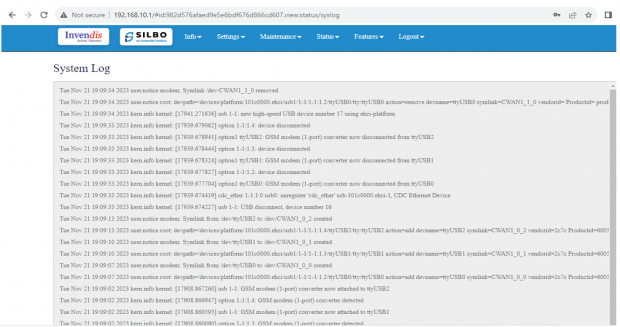
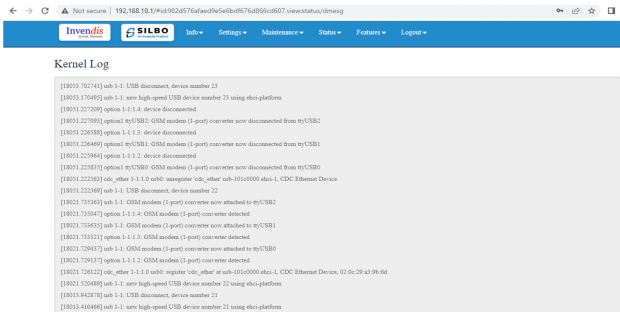
1.3 Kernel Log
This page provides on screen Kernel logging information.
In this page the user gets to view the Kernel logs.
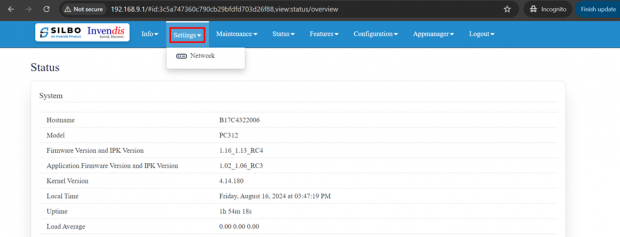
2. Setting
In this “Setting” module the user can Configure/update all the required parameters related to Network and Wifi settings as per requirement.
IT consist of 1 submodule.
- Network
2.1 Network
In this section the user does all the setting related configuration with reference to network like Ethernet Settings and Wi-Fi Settings.
Ethernet Setting:
In this page it will display the configured port that is attached with the device.
For this device 1 port is configured.
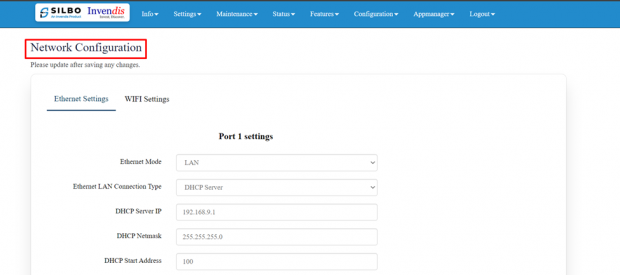
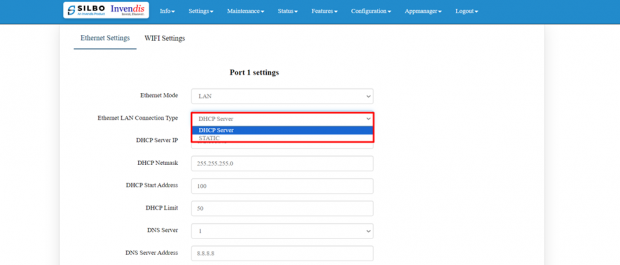
Ethernet LAN Connection settings can be configured as DHCP server or Static.
For port 1 setting,
Kindly select the option LAN for Port 1 mode LAN/WAN. Based on the option selected the field will also change. The user needs to configure all the required field and click on save.
Specification details are given below:
| SN | Field name | Sample value | Description |
| 1 | Ethernet Mode | LAN | This field displays the port mode selection |
| 2 | Port 1 Ethernet Protocol [LAN Eth0.1] | 1.) DHCP Server
2.) Static |
This field displays the Ethernet mode selection |
| 3 | Port 1 DHCP Server IP
Port 1 Static IP |
1.) 192.168.9.1
2.) 192.168.9.1 |
This field displays DHCP server and static IP configured. |
| 4 | Port 1 DHCP and Static Netmask | 255.255.255.0 | This field displays DHCP server and static Netmask address configured |
| 5 | Port 1 DHCP Start Address | 100 | This field displays DHCP server start address configured |
| 6 | Port 1 DHCP Limit | 50 | This field displays DHCP server limit |
| 7 | DNS Server | Options: 1,2 | Select the number of DNS Server to configure (max 2). |
| 8 | DNS server address | Ex: 8.8.8.8 | Enter the DNS server IP address upon selection. |
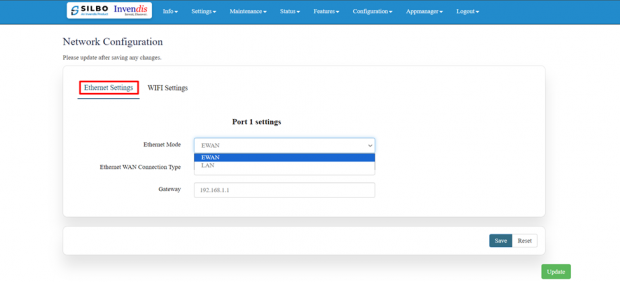
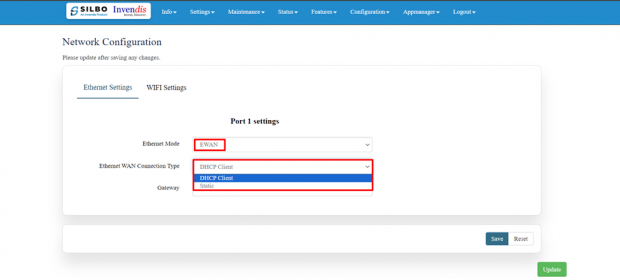
Kindly select the option EWAN for Port 1 mode LAN/WAN. Based on the option selected the field will also change. The user needs to configure all the required field and click on the save to save the required fields.
The specifications details are below.
| SN | Field name | Sample value | Description |
| 1 | Ethernet Mode | EWAN | This field displays the port mode selection |
| 2
|
Ethernet Protocol Port 1 WAN | 1.) DHCP client
2.) Static |
1.) Automatically obtains IP address and network configuration from a DHCP server.
2.) Manually set a fixed IP address and network configuration. |
| 3 | Gateway | 192.168.1.1 | This field displays gateway address configured |
Click on the save once all the configuration is done and click on the update button to update all the information.
Wi-Fi Setting:
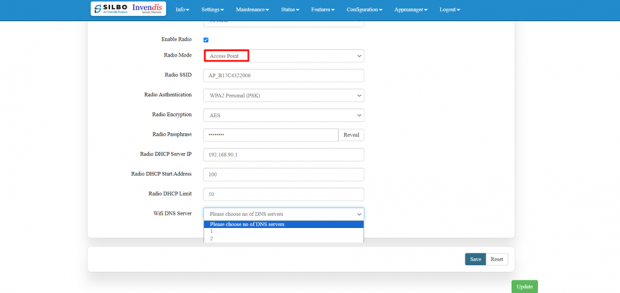
In this, router has the general setting and change country code, channel, radio mode, radio passphrase as per the requirement after clicking on enable Radio button.
It has 1 radio mode,
Access point
Access Point mode:
In Access Point mode, a configuration in which a router, allows wireless devices to connect to a wired network by creating a Wi-Fi hotspot.
The specifications details are below.
| SN | Field name | Sample value | Description |
| 1 | Radio 0 Protocol | IEEE 802.11 b/g/n | This section shows the radio protocol which is by default. |
| 2 | Country Code | INDIA | Select the country accordingly.
(INDIA by default) |
| 3 | Channel | Auto | In this dropdown the user should select the proper channel to be used. (Auto by default) |
| 4 | TX Power | 100 | In this text box the user should specify the power. |
| 5 | Channel Width | 20 MHz | In this dropdown the user should select the channel width |
| 6 | Radio Mode | 1.) Access point | In this drop down the user should select the mode.
(Access point by default) |
| 7 | Radio SSID | AP_37A26230014 | In this text box the user should specify the SSID number which usually comes with the router. |
| 8 | Radio Authentication | WPA2 Personal (PSK) | In this dropdown the user should select the type of authentication.
(WPA2 Personal (PSK) by default) |
| 9 | Radio Encryption | AES | In this dropdown the user should select the type of encryption required.
(AES by default) |
| 10 | Radio Passphrase | ********* | In this text box the user should specify the password. Password will be given with the router which can be changed later. |
| 11 | Radio DHCP server IP | 192.168.100.1 | In this text box the user should specify the IP address of DHCP server.
(192.168.100.1 will be default which can be changed accordingly) |
| 12 | Radio DHCP start address | 100 | In this text box the user should specify the start address of the DHCP.
(100 value is default) |
| 13 | Radio DHCP limit | 50 | In this text box the user should specify the limit for the DHCP.
(50 value is default) |
| 14 | DNS Server | Options: 1,2 | Select the number of DNS Server to configure (max 2). |
| 15 | DNS server address | Ex: 8.8.8.8 | Enter the DNS server IP address upon selection. |
Click on save once changes have been made.
3.Maintenance
In this module the user can configure/upgrade/modify the settings related to system, password,
firmware and monitoring.
It includes 4 submodules.
- General
- Password
- Reboot
- Import and Export config
3.1 General
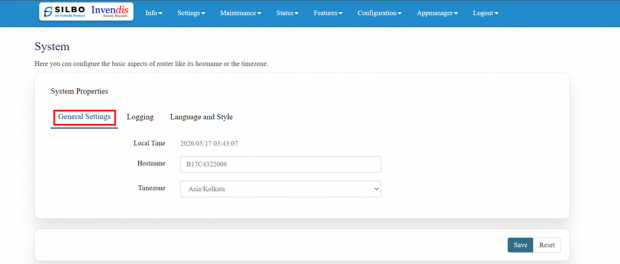
Here you can configure the basic aspects of the Protocol Convertor like its hostname or the time zone.
It is further sub-divided into,
1.) General Settings
2.) Logging
3.) Language and Style
General Settings:
EDIT:
| SN | Field Name | Sample Value | Description |
| 1 | Local Time | 2024/07/30 13:25:47 | The current local date and time set on the device. |
| 2 | Hostname | B17C4322006 | The hostname of the device, which is used to identify it on the network. |
| 3 | Timezone | Asia/Kolkata | The timezone setting of the device, which determines the local time. |
Once the user configures the required details then click on the save button to save all the details.
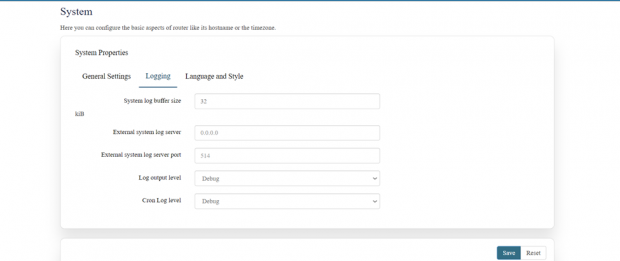
Logging:
Here the user can configure the basic aspects of your device related to system.
The system log configuration provided specifies how the device handles and stores log information, including buffer size, external log server details, and log verbosity levels.
EDIT:
| SN | Field Name | Sample Value | Description |
| 1 | System log buffer size | Example: 32 kiB | The size of the memory buffer allocated (0-32) for storing system logs before they are either written to a file or sent to an external server. |
| 2 | External system log server | Example: 0.0.0.0 | The IP address of an external server where logs can be sent. |
| 3 | External system log server port | Example: 514 | The port used to send logs to the external log server. Port 514 is the default port for syslog. |
| 4 | Log output level | Example: Debug | Sets the detail level of the system logs. |
| 5 | Cron Log level | Example: Debug | The detail level of the logs for cron jobs. |
Once the user configures the required details then click on the save button to save all the details.
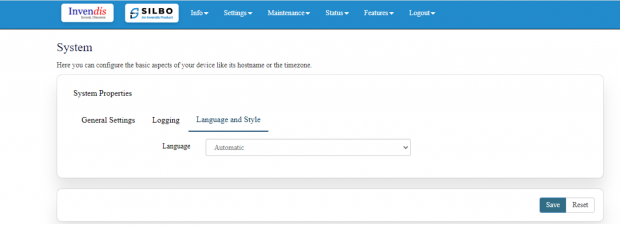
Language and Style:
Here the user can configure the basic aspects of your device related to language.
Once the user configures the required details then click on the save button to save all the details.
3.2 Password
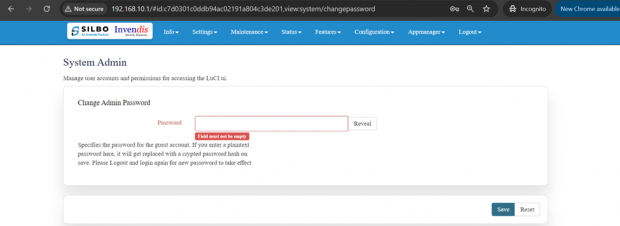
In this module the user can set the password for the admin credentials.
Specifies the password for the guest account. If the user enters a plaintext password here, it will get replaced with a crypted password on save. The new password will be effective once the user logs out and log in again.
3.3 Reboot
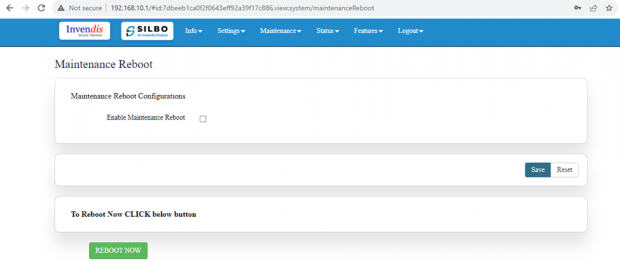
In this module the user can reboot the device remotely.
First option is to directly reboot the device without enabling the maintenance reboot tab.
Click on “Reboot Now” at the bottom of the screen to start the reboot process.
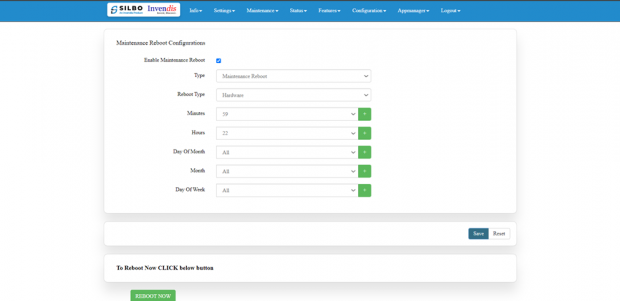
To start maintenance reboot process first the user needs to fill all the required fields.
Need to select the type of reboot for the device whether it needs to be Hardware or Software reboot.
Specification details are given below:
| SN | Field Name | Sample Value | Description |
| 1 | Enable Maintenance Reboot | Enable/Disable | Indicates whether the maintenance reboot feature is enabled or not. |
| 2 | Type | Maintenance Reboot | Specifies the type of reboot being scheduled. |
| 3 | Reboot Type | Software/Hardware | Hardware: A hardware reboot involves restarting the entire device as if it were powered off and on again.
Software: A software reboot involves restarting the operating system without powering off the hardware. |
| 4 | Minutes | Example: 59 | The minute at which the reboot should occur (0-59). |
| 5 | Hours | Example: 22 (10 PM) | The hour at which the reboot should occur (0-23, in 24-hour format). |
| 6 | Day Of Month | Example: All | Specifies which days of the month the reboot should occur (1-31). "All" means it will occur every day. |
| 7 | Month | Example: All | Specifies which months the reboot should occur (1-12). "All" means it will occur every month. |
| 8 | Day Of Week | Example: All | Specifies which days of the week the reboot should occur (0-6, where 0 is Sunday). "All" means it will occur every day of the week. |
Once the user fills all the required given parameters click on the save.
3.4 Import and Export
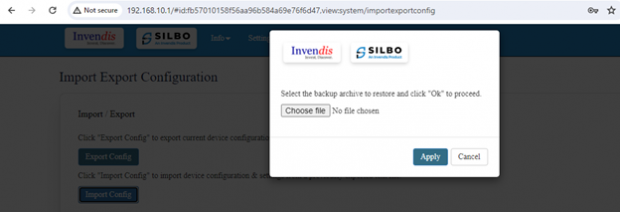
In this section, User can Import & Export Configuration files of the Device.
Click “Export Config” to export device configuration & settings to a text file,
Click “Import Config” to import device configuration & settings from a previously exported text file.
The user needs to select on the “choose file”, upload the required file and click on apply.
4.Status
In this module the user can view the status of the router device with respect to the network, Wan, modem etc.
It has 3 submodules.
- Interfaces
- Routes
- Custom Config
4.1 Interfaces
Each network device (interface) is associated with specific traffic statistics, uptime, and status. Active interfaces are operational.
Looking on the network status the user can check if the ewan is up.
4.2 Routes
This configuration shows how the router directs traffic between different networks and interfaces, ensuring proper communication within the local network and to external networks via the default gateway.
ARP Table: Maps IP addresses to MAC addresses for devices on the network, helping in identifying which device is on which interface.
IPv4 Routes: This shows which network is directly connected on which interface.
Example: Network 192.168.9.0/24 is directly connected on interface eth0.1.
IPv6 Routes: Similar routes as IPv4, but this time listed under IPv6 routing rules.
Example: Local networks 192.168.9.0/24 and 192.168.90.0/24 are managed through eth0.1 and ra0, respectively.
4.3 Custom Config
In this section, webpage logo can be customised as per requirements.
Upload the custom logo by clicking the “Upload” tab below.
5. Features
In this module the user can see all the features that the router device has.
This module includes 3 features.
- Web Server
- Others
- Connection Diagnostics
5.1 Web Server
This configuration will allow your device to serve web traffic securely over HTTPS, keep its system time synchronized, and ensure that all HTTP traffic is redirected to HTTPS for better security.
Specification details are given below:
| SN | Field Name | Sample Value | Description |
| 1 | Enable HTTP | HTTP Port: 80
Enable or disable the HTTP server. |
Port 80 is the default port for HTTP traffic. It is used to serve web pages over an unencrypted connection. |
| 2 | Enable HTTPS | HTTPS Port: 443
Enable or disable the HTTPS server. |
Port 443 is the default port for HTTPS traffic. It is used to serve web pages over an encrypted connection. |
| 3 | Redirect HTTPS | Option to redirect HTTP traffic to HTTPS. | When enabled, all HTTP requests will be automatically redirected to the HTTPS port to ensure secure communication. |
| 4 | Enable NTP Sync | Enable or disable NTP synchronization. | Synchronizes the device’s system clock with an external NTP server to maintain accurate time. |
| 5 | NTP Server | 0.openwrt.pool.ntp.org | The address of the NTP server used for time synchronization. The openwrt.pool.ntp.org server is a public NTP server pool. |
| 6 | NTP Sync Interval (In Minutes) | 15 | The interval at which the device will sync its clock with the NTP server, set to every 15 minutes in this case. |
Click on save once changes are made.
5.2 Others
In this page the user will get to do all the other miscellaneous configuration with respect to the device based on the required parameters. Each utility serves a specific purpose, providing various functionalities for managing and troubleshooting network configurations and statuses.
Specification details are given below:
| SN | Field Name | Sample Value | Description |
| 1 | Set Date | Date and time fields (day, month, year, hour, minute, second) | Sets the system date and time to the specified values. |
| 2 | Get Date | System | Retrieves and displays the current system date and time. |
| 3 | Ping | IP address or domain (e.g., 8.8.8.8) | Sends ICMP echo requests to the specified address to check connectivity. |
| 4 | traceroute | IP address or domain (e.g., 8.8.8.8) | Traces the route packets take to reach the specified address. |
| 5 | NTP Sync | Command ‘Sync’ | Synchronizes the system time with the configured NTP server. |
| 6 | Download Files | File or database identifier | Initiates a download of the specified file or database. |
| 7 | Restart Power | Command ‘Restart’ | Restarts the power of the device. |
| 8 | Show Board Configuration | Command ‘Show’ | Displays the current board configuration. |
| 9 | Output | Any value | Displays output for all the above actions. |
5.3 Connection Diagnostics
This can ensure that your connection diagnostics application effectively monitors and reports the status of your network connections, providing valuable data for troubleshooting and performance optimization.
This Application works in 3 parts,
1.) General settings
2.) Connection status and management
3.) Application Start/Stop
General settings:
First make configuration changes in this section and save.
Specification details are given below:
| SN | Field Name | Sample Value | Description |
| 1 | Enable Connection Diagnostics | Enable/Disable | This option enables or disables the connection diagnostics functionality. |
| 2 | Check Interval (in seconds) | Value: 120 | Specifies how often (in seconds) the diagnostics checks are performed. In this case, every 120 seconds. (min 60 secs) |
| 3 | Number of Pings | Value: 5 | Determines ping requests sent during each check. |
| 4 | Ping Packet Size (in Bytes) | Value: 56 | Defines the size of each ping packet in bytes. |
| 5 | Send to remote MQTT Broker | Enable/Disable | This option enables the sending of diagnostic data to a remote MQTT broker. |
| 6 | Publish Data Format | CSV / JSON | Specifies the format in which the diagnostic data will be published to the MQTT broker. You can choose either CSV (Comma-Separated Values) or JSON (JavaScript Object Notation). |
| 7 | MQTT Broker url | Value: broker.hivemq.com | The URL of the MQTT broker where the diagnostic data will be sent. |
| 8 | TCP port | Value: 1883 | The TCP port used to connect to the MQTT broker. Port 1883 is the default port for MQTT. |
| 9 | Topic | Value: 37A26230014/connectionDiagnostics | The MQTT topic under which the diagnostic data will be published. This topic is used to categorize and identify the data. |
Connection status and management:
To setup a connection,
Click on ‘Add new target’
Enter Target IP (Ex: 8.8.8.8)
Click ‘Add’
Target has been added successfully.
Application Start/Stop:
To check whether the target Ip is sending and receiving packets, you need to start the application to see the desired output.
As shown above, our target Ip is sending packets successfully.
You can Add as many targets IP’s you need to monitor.
You can leave the application on for monitoring else ‘Stop’ the application.

