Connection Diagnostics
Login to GUI of device
Connect router to Laptop or Desktop using a LAN connection or connect over Wi-Fi.
Make sure the laptop/desktop LAN/Wi-Fi interface is in DHCP mode.
How to make LAN/Wi-Fi network interface in DHCP mode into Windows Operating system?
To configure a LAN or Wi-Fi network interface in DHCP mode on a Windows operating system, follow these steps:
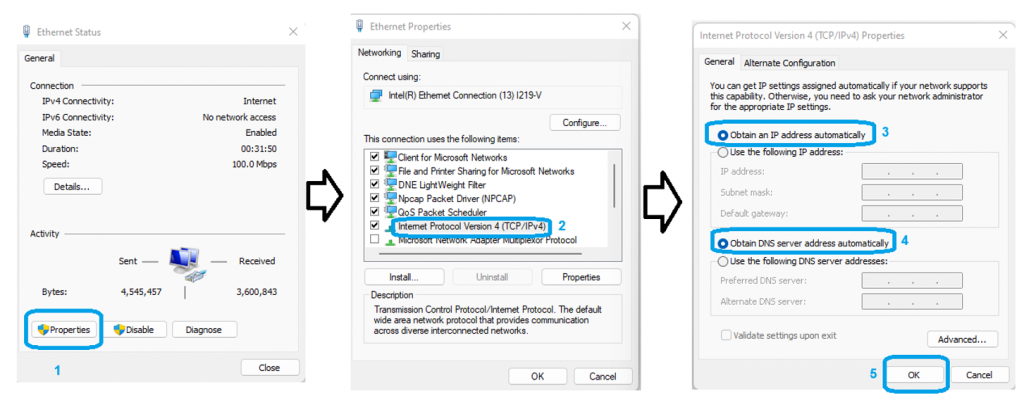
Press Windows + R, type ncpa.cpl, and press Enter to open the Network Connections window.
And locate the correct LAN/Wi-Fi interface which need to be configured as DHCP client or go to below path in the system.
Control Panel\Network and Internet\Network and Sharing Center.
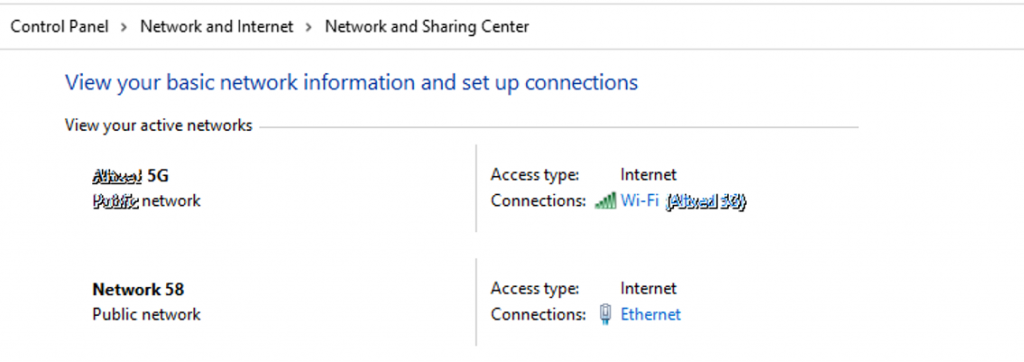 In the above image select the interface Ethernet or Wi-Fi and change the IP Version 4 (TCP/IPv4) and set in DHCP as shown in below image.
Note: Make sure the router’s DHCP server is not disabled if it is disabled then windows system should be configured with static IP “use the following IP
address” option in above image.
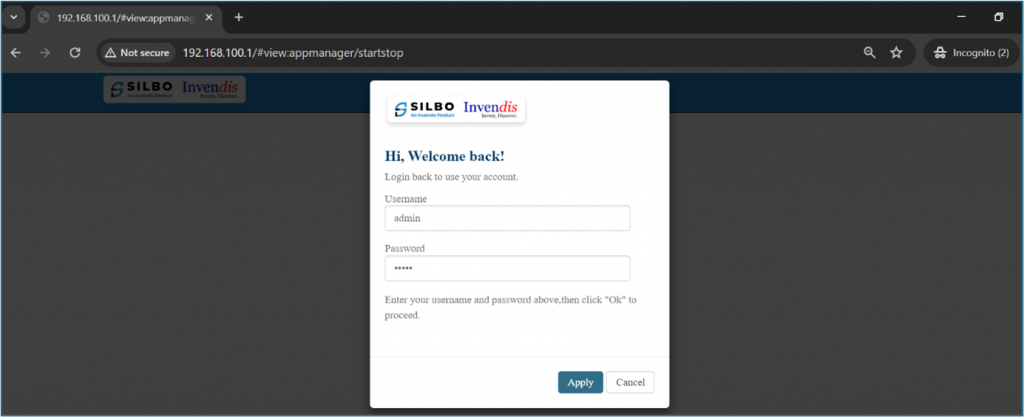
Use default IP of router to access GUI.
For LAN it is 192.168.10.1 and for Wi-Fi it is 192.168.100.1 can be used to acces router in using any browser.
Note: For filed routers if the IP address is changed then the new IP belongs to interface should be used.
Default credentials to login are username/password : admin/admin but if the credentials are changed then use the correct credentials.
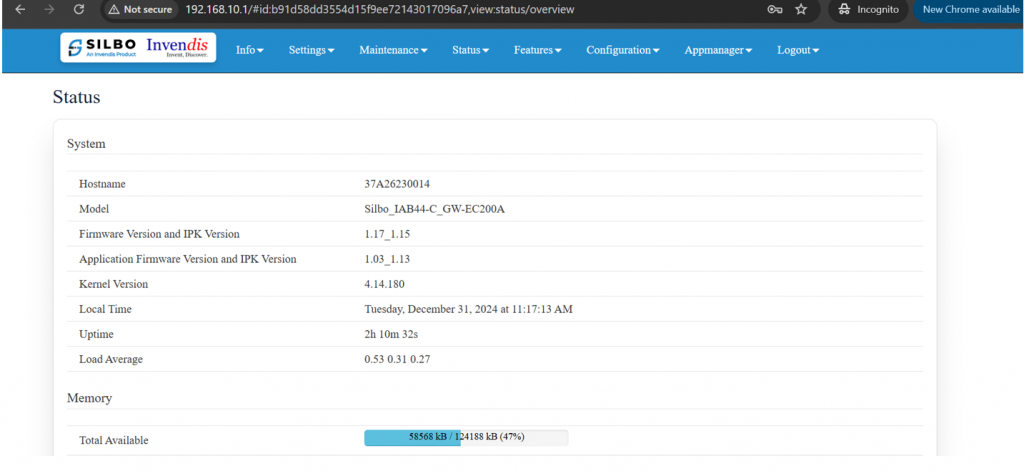 Once logged in to GUI the above screen can be seen where actual information of the device will be present.
Note: All the SILBO routers/gateway with model number RBxx, IAxx-x,RCxx, RDxx, GRDxx, RFxx,IExx etc GUI is same so the proces remains same.
Connection Diagnostics
Connection Diagnostics is used to diagnose the connection between router and end device connected over physical Interfaces like LAN & WAN, or wireless interface Wi-Fi (WLAN) or over VPN like IPsec, PPTP, L2TP, OpenVPN etc.
The device collects ping response from end device and sends the latest record to MQTT Broker hosted locally or over the cloud as shown below.
Note: Any MQTT broker can be used that works without the need of TLS certificate (TLS authentication).
Navigate to Features>> Connection Diagnostics as shown to configure this feature
 This Application has 3 parts listed below
1.) General setting
2.) Connection status and management
3.) Application Start/Stop
General settings:
In general settings configure all parameters as below.
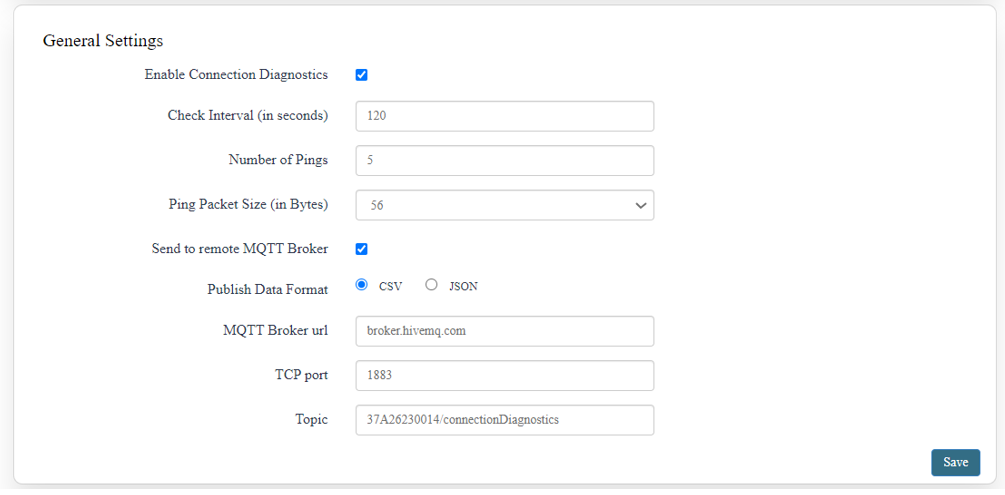
- Check Interval (in seconds): Specifies the time gap between two consecutive diagnostic checks. Example:Value 120 seconds means the system will run diagnostics every 2 minutes. Setting it to 60 seconds would perform checks every minute where 60 seconds is the lowest time interval.
- Number of Pings: Determines how many ping packets to be sent to the target/end device LAN/WLAN IP during each diagnostic cycle. The number of ping count in each cycle can be between 1 to 10. Example:Value 5 means the system will send 5 ping requests per check.
- Ping Packet Size (in Bytes): Configures the size of each ICMP (Internet control message protocol) ping packet. Example:Value 56 bytes is the default packet size in many network tools. Setting it to 128 bytes would send larger packets, which might be useful for stress testing.
- Publish Data Format: It is the format of the diagnostic data to be published in CSV or JSON. CSV (Comma-Separated Values)Example: {Record number, timestamp, checkinterval, DeviceName, target IP, Diagnostic packet, Second target IP, diagnostic info of second target IP and so on} JSON (JavaScript Object Notation):Example: {“SerialNumber”: {recordNumber: 3, “DateTime”:18/12/2024 09:49:03, “DiffTimeFromLastDataSent”:60, “DeviceName”:37xxxxxx8, “target IP”:5/5/%,} }
- MQTT Broker URL Specifies the address of the MQTT broker that will receive diagnostic data. Example:Value broker.hivemq.com refers to a publicly available MQTT broker.
- TCP Port for MQTT Defines the network port for communicating with the MQTT broker. Example:Value 1883 is the standard port for unencrypted MQTT communication. For secure MQTT over TLS, you might use port 8883.
- Topic Indicates the MQTT topic to which the diagnostic data will be published.
Connection status and management:
To setup a connection,
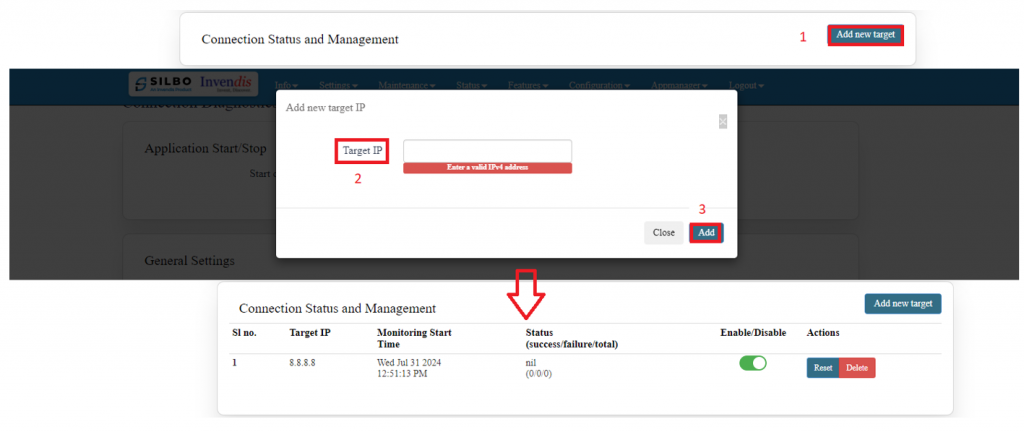
Click on ‘Add new target’
Enter Target IP (Ex: 8.8.8.8)
Click ‘Add’
‘Configuration saved successfully’ pop-up is shown after which target IP will be seen in the Connection and Management tab as shown below.
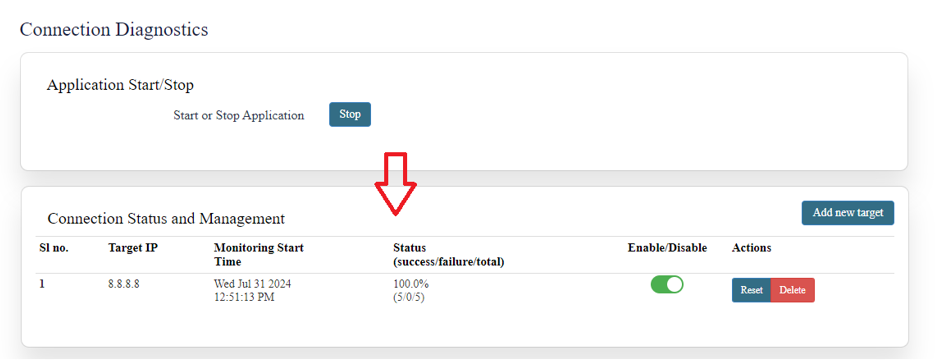
To check whether the target IP is sending and receiving ping response, start the application to see the output.
As seen in the above image, target IP is sending and receiving ping response successfully.
Add as many target IP’s you need to monitor.
Leave the application on for monitoring else ‘Stop’ the application.
Cloud/MQTT Broker receives all the individual packets as records from router/gateway in below format.
Number of Ping packets sent/ successful ping packets / % packets failure
CSV Output:
Example:
{Record number, timestamp, checkinterval, DeviceName, target IP, Diagnostic packet, Second target IP, diagnostic info of second target IP and so on}
JSON Output:
Example:
{“SerialNumber”: {recordNumber: 3, “DateTime”:18/12/2024 09:49:03, “DiffTimeFromLastDataSent”:60, “DeviceName”:37xxxxxx8, “target IP”:5/5/%,} }

